Types of Stocks
Explore the different categories of stocks, learn how to identify them in practice, and understand which types match your investment goals.
Learning Objectives
- Distinguish between common and preferred stock
- Identify growth stocks vs. value stocks using real metrics
- Learn how market capitalization categorizes companies
- Recognize different sector classifications
- Understand international stock investing
Types of Stocks#
Walk into a grocery store, and you'll find apples organized by type: Honeycrisp for sweetness, Granny Smith for tartness, Fuji for crunch. The stock market works similarly. Understanding stock types helps you pick the right ones for your portfolio's "recipe."
Knowing the types of stocks helps you build a diversified portfolio that balances potential returns with your personal risk tolerance. More importantly, it helps you understand why stocks behave differently.
Common Stock vs. Preferred Stock#
The two fundamental classes of stock are common and preferred—and the difference matters more than most beginners realize.
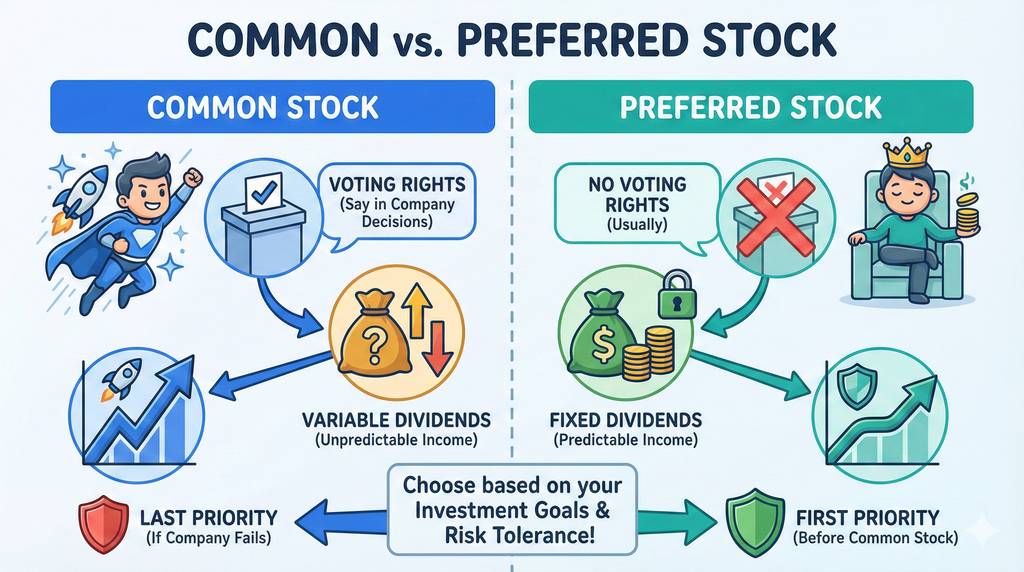
Common Stock#
Common stock is what most people mean when they talk about "stocks." It's the standard form of ownership that comes with:
- Voting rights on company matters (typically one vote per share)
- Variable dividends that can increase, decrease, or be eliminated
- Higher growth potential as the company succeeds
- Last priority in receiving assets if the company fails
Most individual investors own common stock because it offers the best opportunity for capital appreciation.
Preferred Stock#
Preferred stock is a hybrid between stocks and bonds:
- Fixed dividends that are typically higher and more predictable
- Priority over common stock for dividend payments
- Limited or no voting rights in most cases
- Less price volatility than common stock
- Less upside potential when the company grows
| Feature | Common Stock | Preferred Stock |
|---|---|---|
| Voting Rights | Yes | Usually No |
| Dividend Priority | Last | Before common |
| Dividend Type | Variable | Usually fixed |
| Price Volatility | Higher | Lower |
| Growth Potential | Higher | Limited |
Practical Example: Bank of America pays common shareholders a variable dividend (currently ~$0.24/quarter). Its preferred shares pay a fixed 6% annually. If you invest $10,000 in preferred shares, you'll receive about $600/year reliably. Common shareholders might get more—or less—depending on bank profits.
Preferred stock is often attractive to income-focused investors who want reliable dividends without the volatility of common stock. Retirees often favor them.
Growth Stocks vs. Value Stocks#
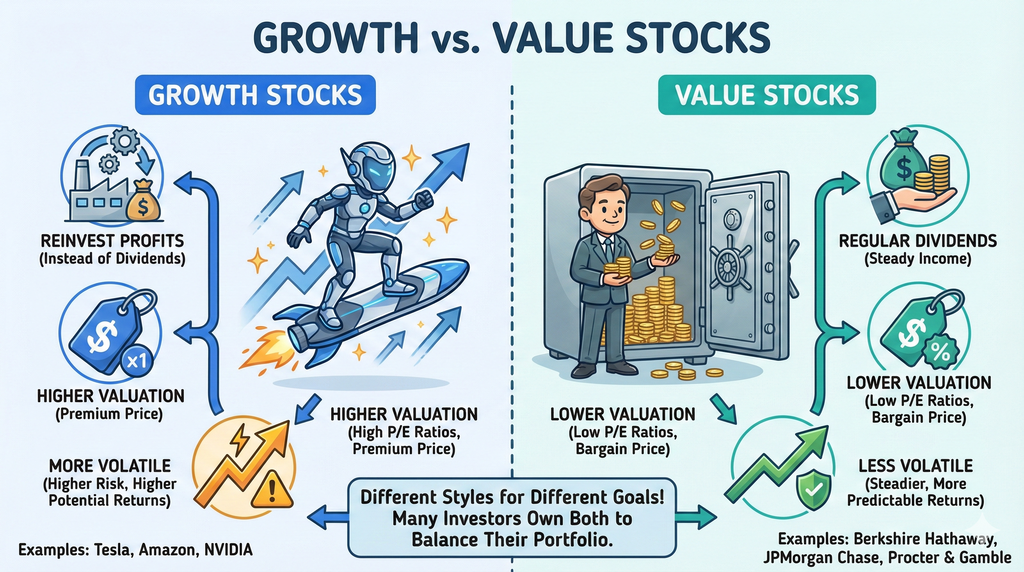
This is one of the most important distinctions in investing. Understanding it will shape your entire investment strategy.
Growth Stocks#
Growth stocks are shares in companies expected to grow faster than the overall market:
- Reinvest profits rather than paying dividends
- Trade at higher valuations (high price-to-earnings ratios)
- Found in innovative sectors like technology and healthcare
- More volatile but potentially higher returns
How to Identify a Growth Stock#
Look for these telltale signs in any stock screener or company report:
| Metric | Growth Stock Signal | Example |
|---|---|---|
| Revenue Growth | >15% annually | NVIDIA grew revenue 122% in 2024 |
| P/E Ratio | >25 (often 40-100+) | Amazon trades at 60x earnings |
| Dividend | None or tiny | Tesla pays no dividend |
| Market Position | Disrupting incumbents | Netflix vs. traditional TV |
| Industry | Tech, biotech, e-commerce | Cloud computing, AI, electric vehicles |
Real-World Example: Is Apple a Growth Stock?
Let's analyze Apple using the metrics above:
- Revenue growth: ~8% (moderate, not explosive)
- P/E ratio: ~28 (elevated but not extreme)
- Dividend: Yes, ~0.5% yield
- Position: Dominant but mature
Verdict: Apple is a mature growth stock—it was a pure growth stock in the 2010s but now shows characteristics of both growth and value. This is common for successful companies as they mature.
Value Stocks#
Value stocks are shares in companies that appear underpriced relative to their fundamentals:
- Pay regular dividends to shareholders
- Trade at lower valuations (low price-to-earnings ratios)
- Established, mature businesses with stable earnings
- Less volatile with steadier, more predictable returns
How to Identify a Value Stock#
| Metric | Value Stock Signal | Example |
|---|---|---|
| P/E Ratio | <15 (ideally <12) | JPMorgan at 11x earnings |
| P/B Ratio | <1.5 | Many banks trade below book value |
| Dividend Yield | >2% | Verizon yields ~6.5% |
| Revenue Growth | <10% (stable, not explosive) | Coca-Cola grows ~5% annually |
| Industry | Banks, utilities, consumer staples | Insurance, telecom, food |
Real-World Example: Is Coca-Cola a Value Stock?
Analyzing Coca-Cola:
- P/E ratio: ~24 (a bit high for pure value)
- Dividend yield: ~3% (solid income)
- Revenue growth: ~5% (stable, predictable)
- Business: 137-year-old beverage company
Verdict: Coca-Cola is a dividend aristocrat—a value stock with consistent dividend growth. It's defensive and stable but won't deliver explosive returns.
Growth vs. Value: The Eternal Debate
Neither style is inherently better. Growth stocks tend to outperform during economic expansions (2009-2021), while value stocks often do better during downturns and high-inflation periods (2022). Many investors hold both for balance.
The Growth-Value Spectrum#
Stocks exist on a spectrum, not in binary categories:
| Category | Examples | Characteristics |
|---|---|---|
| Pure Growth | Tesla, NVIDIA | No dividends, 50+ P/E, rapid expansion |
| Growth-at-Reasonable-Price (GARP) | Microsoft, Visa | Some dividends, 25-35 P/E, steady growth |
| Dividend Growth | Johnson & Johnson, Apple | Rising dividends, 15-25 P/E, mature growth |
| Classic Value | JPMorgan, Chevron | High dividends, <15 P/E, cyclical |
| Deep Value | Distressed companies | Very low valuations, turnaround situations |
Classification by Market Capitalization#
Market capitalization (or "market cap") measures a company's total market value:
Market Cap = Stock Price × Total Shares Outstanding
Example: If Apple trades at $200 with 15 billion shares outstanding:
- Market Cap = $200 × 15B = $3 trillion (the world's most valuable company)
Companies are typically grouped into these categories:
| Classification | Market Cap | Risk/Reward Profile | Examples |
|---|---|---|---|
| Mega-Cap | $200B+ | Most stable, global leaders | Apple, Microsoft, Amazon |
| Large-Cap | $10-200B | Lower risk, established | Nike, Starbucks, Netflix |
| Mid-Cap | $2-10B | Moderate risk, growth potential | Etsy, Five Below, Zillow |
| Small-Cap | $300M-$2B | Higher risk, higher potential | Local banks, emerging tech |
| Micro-Cap | Under $300M | Highest risk, least liquid | Early-stage companies |
Blue-Chip Stocks#
Blue-chip stocks are a special category of large-cap stocks known for their quality:
- Industry leaders with long track records
- Consistent dividend payments
- Household name brands
- Found in major indices like the Dow Jones
Examples: Apple, Microsoft, Coca-Cola, Johnson & Johnson, Procter & Gamble
The term "blue-chip" comes from poker, where blue chips have the highest value. Blue-chip stocks are considered the most valuable and reliable—but they can still drop 30%+ in bear markets.
Sector Classifications#
Stocks are also grouped by the industry they operate in. The Global Industry Classification Standard (GICS) defines 11 sectors:
| Sector | Examples | Economic Sensitivity |
|---|---|---|
| Technology | Apple, NVIDIA, Salesforce | High (cyclical) |
| Healthcare | J&J, Pfizer, UnitedHealth | Low (defensive) |
| Financials | JPMorgan, Visa, Berkshire | Moderate |
| Consumer Discretionary | Amazon, Tesla, Nike | High (cyclical) |
| Consumer Staples | Coca-Cola, P&G, Walmart | Low (defensive) |
| Energy | Exxon, Chevron, NextEra | High (commodity-linked) |
| Industrials | Boeing, Caterpillar, UPS | Moderate (cyclical) |
| Materials | Linde, Sherwin-Williams | High (cyclical) |
| Utilities | Duke Energy, Southern Co | Very Low (defensive) |
| Real Estate | Prologis, American Tower | Moderate |
| Communication Services | Alphabet, Meta, Disney | Moderate |
Defensive vs. Cyclical Sectors#
| Economic Condition | Sectors That Typically Outperform |
|---|---|
| Recession | Utilities, Consumer Staples, Healthcare |
| Early Recovery | Financials, Industrials, Real Estate |
| Mid-Expansion | Technology, Consumer Discretionary |
| Late Expansion | Energy, Materials |
Understanding sector rotation helps you position your portfolio for different economic environments.
Domestic vs. International Stocks#
Diversifying beyond your home country adds another dimension to your portfolio.
Types of International Investments#
| Category | Definition | Examples | Considerations |
|---|---|---|---|
| Domestic | Companies in your country | Apple, Walmart (for US investors) | Home currency, familiar regulations |
| Developed International | Advanced economies | Nestlé (Switzerland), Toyota (Japan), LVMH (France) | Stable but currency risk |
| Emerging Markets | Growing economies | Alibaba (China), HDFC (India), MercadoLibre (Latin America) | Higher growth, higher risk |
| Frontier Markets | Early-stage economies | Vietnam, Nigeria, Bangladesh | Highest risk, least liquid |
Why Invest Internationally?#
| Reason | Explanation |
|---|---|
| Diversification | Different economies move independently |
| Growth Opportunities | Emerging markets grow faster than developed |
| Currency Diversification | Hedge against home currency weakness |
| Access to Leaders | Some world-class companies are foreign (Nestlé, ASML, TSMC) |
International Investment Risks#
| Risk | Description | Mitigation |
|---|---|---|
| Currency Risk | Foreign currency may weaken vs. yours | Hedged ETFs, long-term holding |
| Political Risk | Government instability, policy changes | Diversify across regions |
| Regulatory Risk | Different accounting standards, disclosure | Stick to ADRs and large-cap foreign stocks |
| Liquidity Risk | Harder to buy/sell in some markets | Use ETFs rather than individual stocks |
How to Access International Stocks#
- ADRs (American Depositary Receipts): Foreign stocks traded on US exchanges (e.g., BABA for Alibaba)
- International ETFs: Baskets like VEU (all non-US), EEM (emerging markets)
- International Mutual Funds: Actively managed foreign stock funds
- Direct Foreign Investment: Buying on foreign exchanges (complex, higher costs)
Don't Over-Allocate
While international diversification is valuable, most financial advisors suggest 20-40% international exposure, not 50%+. Your home country typically offers the investments you understand best.
Matching Stock Types to Your Goals#
| Your Goal | Recommended Stock Types | Why |
|---|---|---|
| Long-term growth (20+ years) | Growth stocks, small-caps, emerging markets | Time to recover from volatility |
| Income in retirement | Dividend stocks, preferred shares, REITs | Reliable cash flow |
| Stability with some growth | Blue-chips, dividend aristocrats | Lower volatility, steady returns |
| Defensive positioning | Utilities, consumer staples, healthcare | Hold value in downturns |
| Maximum diversification | Mix of all types across sectors and regions | Reduces overall risk |
Key Takeaways
- Common stock offers voting rights and growth potential; preferred stock offers fixed dividends and priority - Growth stocks have high P/E ratios (>25), reinvest profits, and prioritize expansion—identify them by revenue growth >15% and no/low dividends - Value stocks have low P/E ratios (<15), pay dividends, and appear underpriced—look for dividend yields >2% and stable businesses - Market cap categorizes companies by size: mega-cap ($200B+), large-cap ($10-200B), mid-cap ($2-10B), small-cap, micro-cap - Blue-chip stocks are large, established companies with reliable track records (Apple, Coca-Cola, J&J) - Sectors group companies by industry—defensive sectors (utilities, staples) resist recessions; cyclical sectors (tech, discretionary) amplify growth - International stocks add diversification but introduce currency and political risks—consider 20-40% foreign exposure - Match stock types to your goals: growth for long-term, dividends for income, blue-chips for stability